AWS CloudWatch is a powerful service for monitoring resources and applications. While AWS automatically provides metrics for most services, sometimes you need to create custom metrics that CloudWatch do not provide by default. For example, to track whether your data ingestion flow or API is receiving data from specific data providers.
In this post, we’ll walk through how to:
- Push custom metric from a Lambda function
- Create CloudWatch alarms for this metric
- Trigger a notification Lambda when thresholds are breached
AWS solution used as example
Note that business logic is excluded from the solution used in example.
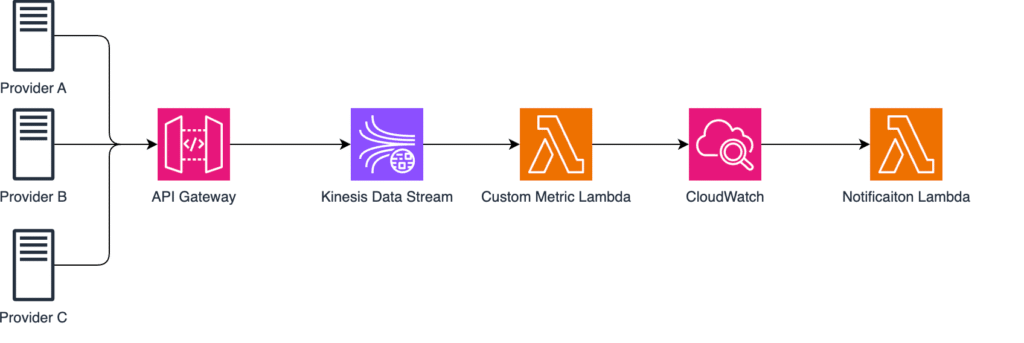
Imaging we have three external data providers continuously sending some telemetry data data to our system. Each provider pushes real-time payloads through API Gateway endpoint and from there the data is ingested directly into Kinesis Data Stream which serves as scalable buffer for real time data streaming.
Lambda function is then triggered automatically whenever new data points arrive typically handling small batches of data. Lambda checks data, validate the payload and other things needed and publishes custom CloudWatch metrics that track activity per provider named “IncomingRequests” specifically.
CloudWatch metrics are continuously evaluated by CloudWatch alarms which can trigger another Lambda function that is responsible for sending alerts (via AWS SNS, Teams, email, etc.) whenever data flow stops.
1. Publishing Custom Metrics from Lambda
Let’s start with a simple Lambda that checks if providers have sent data recently. This Lambda is triggered by Kinesis Data Stream events and processes incoming batches of records. For each Lambda invocation, it counts how many data points were received per provider, then publishes those counts as custom CloudWatch metrics under specific namespace ApiGateway/RequestsPerProvider. These metrics then allows you to monitor the activity of each provider and detecting when a provider stops sending data which triggers an alarm. Nevertheless you can monitor if data sending rate is too high.
import boto3
import os
import json
import logging

logger = logging.getLogger()
logger.setLevel("INFO")

cloudwatch = boto3.client("cloudwatch")

def lambda_handler(event, context):
    records = event.get("Records", [])
    logger.info(f"Received {len(records)} records from Kinesis")

    provider_counts = {}
    for record in records:
        payload = json.loads(record["kinesis"]["data"])
        provider = payload.get("provider", "Unknown")
        provider_counts[provider] = provider_counts.get(provider, 0) + 1

    for provider, count in provider_counts.items():
        cloudwatch.put_metric_data(
            Namespace="ApiGateway/RequestsPerProvider",
            MetricData=[
                {
                    "MetricName": "IncomingRequests",
                    "Dimensions": [{"Name": "Provider", "Value": provider}],
                    "Value": count,
                    "Unit": "Count",
                }
            ],
        )
        logger.info(f"Published {count} requests for {provider}")

    return {"statusCode": 200, "body": json.dumps("Metrics published.")}
We loop through all data and count amount of data points each provider sent in current batch. It parses each records’s JSON payload, extract the provider name and updates dictionary that keeps track of number of events per provider.
Here is an example of how MetricData might look:
MetricData = [
    {
        "MetricName": "IncomingRequests",
        "Dimensions": [{"Name": "Provider", "Value": "ProviderA"}],
        "Value": 42,
        "Unit": "Count"
    },
    {
        "MetricName": "IncomingRequests",
        "Dimensions": [{"Name": "Provider", "Value": "ProviderB"}],
        "Value": 17,
        "Unit": "Count"
    },
    {
        "MetricName": "IncomingRequests",
        "Dimensions": [{"Name": "Provider", "Value": "ProviderC"}],
        "Value": 0,
        "Unit": "Count"
    }
]2. Creating CloudWatch Alarms with Terraform
Now that Lambda is publishing custom metrics, we’ll use Terraform to define alarms for each provider.
If a provider sends fewer than one request in 15 minutes, an alarm will trigger.
resource "aws_cloudwatch_metric_alarm" "api_gateway_requests_alarm" {
  for_each = toset(["ProviderA", "ProviderB", "ProviderC"])

  alarm_name          = "ApiGatewayRequestsAlarm-${each.key}"
  comparison_operator = "LessThanThreshold"
  evaluation_periods  = 1
  metric_name         = "IncomingRequests"
  namespace           = "ApiGateway/RequestsPerProvider"
  period              = 900 # 15 minutes
  statistic           = "Sum"
  threshold           = 1
  alarm_description   = "Provider ${each.key} didn't send data in the past 15 minutes."
  alarm_actions       = [aws_lambda_function.alarm_notifier.arn]
  ok_actions          = [aws_lambda_function.alarm_notifier.arn]
  dimensions = {
    Provider = each.key
  }
  treat_missing_data = "breaching"
}
This resource watches the same custom metric published by the Lambda function — IncomingRequests under the namespace ApiGateway/RequestsPerProvider.
The alarm filters by the Provider dimension (ProviderA, ProviderB, ProviderC), which matches exactly how the Lambda defines dimensions in the put_metric_data method.
Basically, the alarm triggers if the sum of records in a 15-minute period is less than 1, meaning no data arrived.
As you might notice, there are two actions:
- alarm_actions – triggers when the threshold is breached (e.g., no data is received from a provider)
- ok_actions – triggers when the metric returns to normal (e.g., data flow has resumed and the provider is sending data again)
The comparison operator can have different values, but in this example we use LessThanThreshold with threshold = 1, meaning the alarm triggers if total requests from any provider are below 1.
Since evaluation_periods = 1, the condition must be true for only one 15-minute period before the alarm changes state.
The statistic = “Sum” aggregates all metric data points within the period to calculate the total count.
Finally, with treat_missing_data = “breaching”, we ensure that if the metric is missing entirely — for example, if the Lambda fails or stops pushing metrics — CloudWatch still treats it as a breach and triggers the alarm.
3. Sending Notifications from the Alarm Lambda
Final step is to trigger Lambda which acts as the notification handler. Whenever CW Alarm changes it state either to ALARM (no data received) or back to OK (data flow resumed) – this Lambda is automatically triggered via alarm_actions and ok_actions we configured in step 2.
import boto3
import json
import logging
import os
import urllib3

logger = logging.getLogger()
logger.setLevel("INFO")

sns = boto3.client("sns")
http = urllib3.PoolManager()

SNS_TOPIC_ARN = os.environ.get("SNS_TOPIC_ARN")
TEAMS_WEBHOOK_URL = os.environ.get("TEAMS_WEBHOOK_URL")

def send_teams_alert(title, message):
    payload = {"text": f"**{title}**\n{message}"}
    http.request("POST", TEAMS_WEBHOOK_URL, body=json.dumps(payload), headers={"Content-Type": "application/json"})

def send_sns_alert(subject, message):
    sns.publish(TopicArn=SNS_TOPIC_ARN, Subject=subject, Message=message)

def lambda_handler(event, context):
    logger.info("Received CloudWatch alarm event")
    logger.debug(event)

    alarm_name = event["detail"]["alarmName"]
    new_state = event["detail"]["state"]["value"]


    message = f"Alarm `{alarm_name}` is now `{new_state}`."
    title = f"🔔 CloudWatch Alarm Triggered: {alarm_name}"

    # Notify via Teams and SNS
    send_teams_alert(title, message)
    send_sns_alert(title, message)

    logger.info(f"Alert sent for {alarm_name}")
This Lambda has two methods used to send notifications:
- MS Teams – using webhook defined by the environment variable
- AWS SNS – via topic ARN which can fan-out alerts to email, SMS and other
Within Lambda handler we first extract key details from the event, such as alarm name and the new state. These values are used to build simple, human-readable message.
What we have achieved ?
We’ve built a lightweight but very powerful and customizable monitoring pipeline. With this approach we can track application specific behaviours. These metrics shine in scenarios where we aren’t focused on the infrastructure level rather business logic and integrations.
Potential use cases for custom metrics:
- Low throughput alert
- Error spike detection
- Utilization of optional attributes in payload
- Data quality issues
- High latency warnings
- Custom business threshold
- Processing backlog
Conclusion
Custom Metrics in AWS with Lambda and CloudWatch Alarms give us the power to monitor exactly what matters to their applications.
By leveraging Lambda, CloudWatch, and Terraform, you can create a serverless observability pipeline that detects issues like missing data, low throughput, or performance degradation in real time.
This approach not only improves visibility but also enables automated alerting and faster incident response, keeping your systems reliable and your teams informed.
If this blog saved you time, support me with a coffee!

Thanks to everyone who’s supported!